Error graphs
Errors are only displayed in a pie chart. It is possible to check the reason of error visually. Searching for error reason that occured in the specific domain is possible, since the error condition per domain can be checked.
Checking the graph
-
Click the
Delivery Reporttab in the management console. -
Choose the target server configuration from the list on the left. If you would like to display logs per API user click on the plus
+button in server configuration and open this list. -
Click the
Error Graphtab
-
Clicking on the Display button will show the error(s) that occured within the specified period of time in the pie chart. For information refer to the error status.
Graph data aggregation
The error graph can be grouped using the below parameters:
| Parameter | Description |
|---|---|
| Aggregation Unit | Specifies either All, Domain or Error status. |
| Start Date | Input the aggregation start period as YYYY-MM-DD HH:MM format. |
| Aggegation Period | The user defined period of time that is used in aggregation and plotting of the graphs. |
| Domain | Displays when specifying the "Domain" in aggregation unit. Specify the ISP domain to be aggregated. |
| Error status | Display when specifying the [Error status] in the aggregation unit. Specify the error status to be aggregated. |
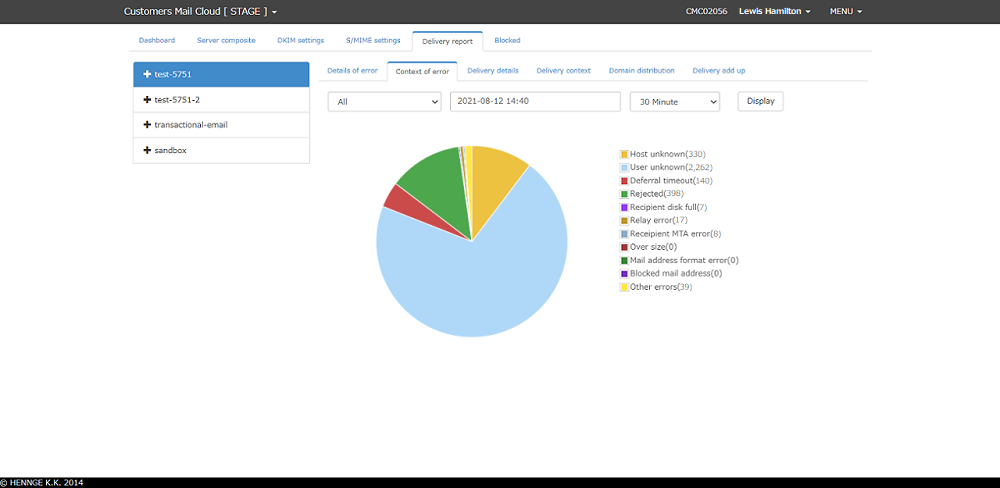
All
Groups all of the errors during the aggregation period based on the specified "Domain" for each error status. You can use this view to determine frequently occuring errors amongst all sent mail.
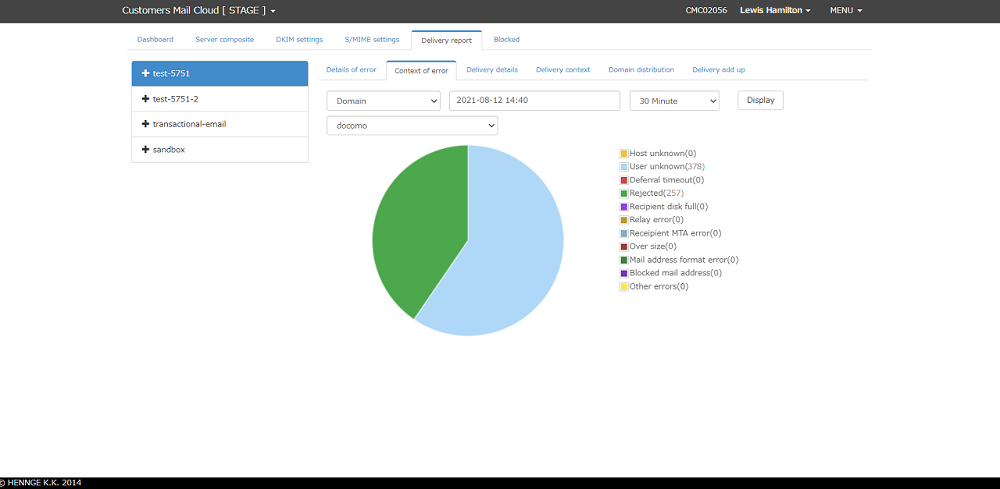
Domain
Groups all of the errors during the aggregation period based on the specified "Domain" for each error status. This allows for a legible view to determine what kind of errors are occurring frequently on a specific domain.
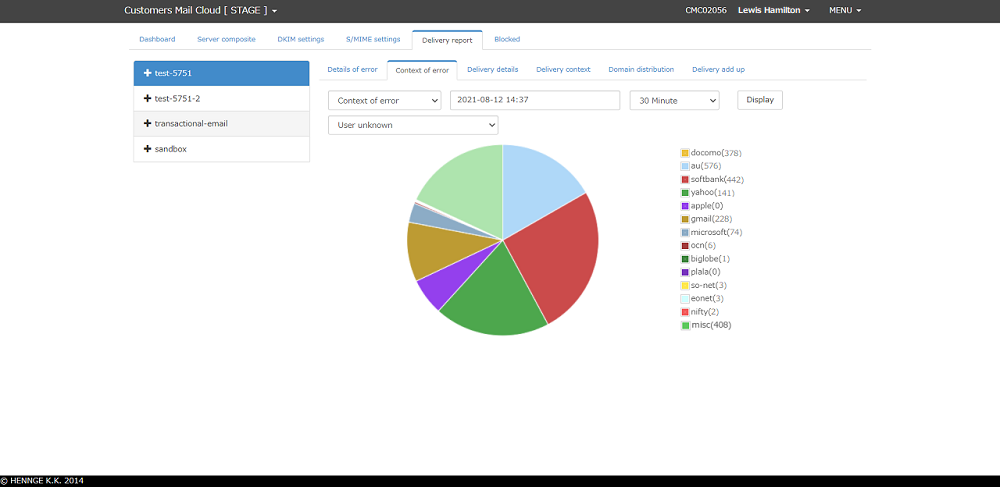
Error Status
Groups all of the errors during the aggregation period based on the specified "Error status" for each domain. This allows for a legible view to determine which domains are most likely to have a particular error status.